It’s Time

Most owls rely on their ability to extract information from visual images, and the Dunwoody owl is no different.  With that in mind, I took the latest high school and middle school attendance area map from the DeKalb County Schools and overlaid circles with a 2½ mile radius over each of the high schools¹.  I then took the October 2015 capacity information and color coded the circles:

  • Red for schools that are currently at 105% of capacity or higher
  • Green for schools between 70% and 105%
  • Blue for schools that are under 70% of capacity


Here is the result:

MHS-2.5-CC


Over at Dunwoody School Daze, Kirk Lunde makes a very strong case for the need to redistrict to help solve the overcrowding in the Cross Keys cluster.

The visualization above reinforces Kirk’s statement that we need to address more than just Cross Keys’ overcrowding.  One third of our high schools are overcrowded.  And almost all of them are clustered in the Druid Hills/Lakeside/Tucker corridor.  This can’t be solved by simply carving out a neighborhood here and there.  The fastest way to alleviate this is a southward shift in attendance.

But that’s just a temporary solution.  The population trends are clear, even if some people claim not have seen them.

I think there’s a further step to take.

Let’s look more closely at the overcrowded area.


DoravilleHS2

There’s a section that is not within 2½ miles of any high school, yet has overcrowded schools around it.  As we enter the discussion for eSPLOST V, It’s time to think about something different.

A new high school in Doraville can alleviate overcrowding in Cross Keys, as it will draw off the northeastern end of that bizarrely shaped attendance zone.  It can alleviate crowding at Lakeside and Tucker by drawing off of some of their attendance zones.  It can even alleviate overcrowding at Dunwoody, as that attendance area borders Doraville.

By all means, we need to ease the overcrowding now, and redrawing attendance zones is probably going to be necessary.

But I believe it’s time to think boldly.  It’s time to actually build for the future, not react to the past.

It’s time for Doraville High.


¹The circle over Cross Keys is not centered over the school due to the inability to draw outside the boundaries of the original document.  Nevertheless, this does not impact the conclusions.

Outliers

In my last post, I noted the gap between the scores we had become accustomed to seeing with the CRCT tests and the scores from the national standardized tests, and noted that the (much lower) scores from the new Georgia Milestones tests are probably more closely aligned to the national tests.  I then noted how poorly we had performed on those tests.

And therein lies another problem.  Because if the Milestones results are accurate, then the press release from the school system touting our improved graduation rate doesn’t seem possible.

Something doesn’t add up.

Previously, I looked at some of the reported gains in graduation rate at our high schools, taking special note of the 20 point gain at Miller Grove High School.  That jump seemed out of the ordinary, but with no standardized test to compare results against other schools, there was no way to confirm that.

Now we have the numbers.

But before we look at the 2015 results, it’s useful to obtain a baseline by looking at the 2013 and 2014 numbers.  Taking the graduation rates at schools reference in the prior posts, and plotting them against the End of Course composites we get the following:

2013 Grad vs EOC

2014 Grad vs EOC

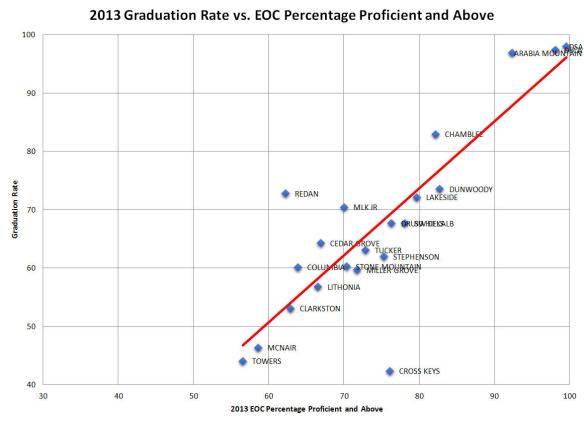
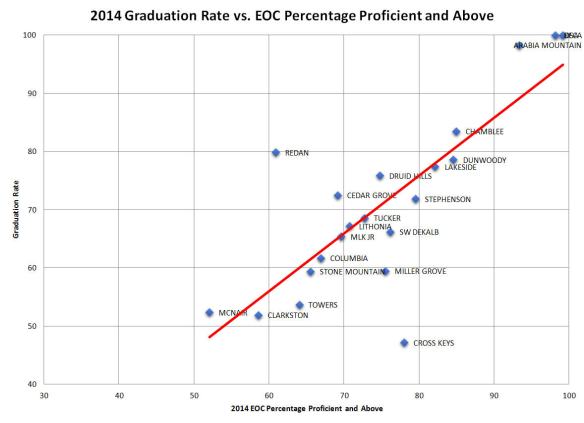
What does this show us?  For most schools, there is a rough correlation between students passing the End of Course tests and the graduation rate.  This isn’t surprising; the End of Course tests are used as the final exams and count for 20% of the grade for the course.

Miller Grove shows up in 2013 as being in line with the other schools, and being on the low end of graduation rate in 2014.

However, there are two things that jump out on these graphs.

The first is Cross Keys.  Cross Keys scored in the middle of the pack on the standardized tests, yet the graduation rate is the lowest of the schools considered.  The data implies that these students should be performing better than they are.  There’s more to the picture then just the what the numbers indicate.

One major contributing factor is most likely the underlying demographics at Cross Keys.  They have a highly transient population.  Even though DeKalb County Schools are doing a much better job of tracking where students go when they leave a school, there is nothing they can do if the child is moved out of state and the parents don’t officially withdraw them from the school.  Those students count as dropouts and Cross Keys ends up with a lower graduation rate even if those kids eventually graduate somewhere else.  Even if we improve performance across the county, I suspect Cross Keys will consistently track 10-20 points lower in graduation rate until the underlying demographics change.

The second, more puzzling, outlier is Redan.  Redan had higher graduation rates than the bulk of schools in DeKalb County, yet had the third lowest percentage of students who met the CRCT standards.   The schools surrounding Redan (Lithonia, Stone Mountain, Stephenson, Clarkston, and yes, Miller Grove) all fall closely along the trendline.  Yet Redan stands out.  In the immortal words of Buffalo Springfield, “There’s something happenin’ here…”

It appears that the students at Redan performed much better on the remaining 80% of their coursework than their peers did.  It would be interesting to learn what the teachers did differently at that school.

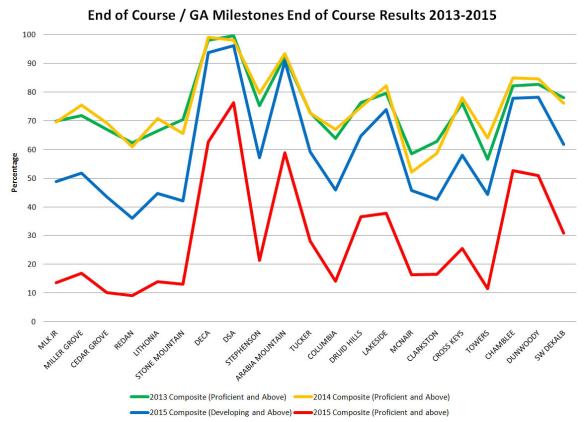
But enough about the past.   It’s 2015.   And the Milestone tests don’t count toward the grade.  What do the numbers tell us now?

2015 Grad vs MS-Dev


2015 Grad vs MS-Prof

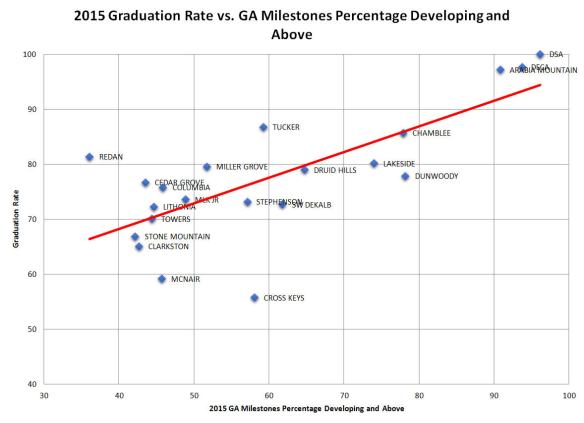
We will take a look at the “Developing Learner” ranking first.  It uses the same horizontal scale as the previous two graphs and is the closest we get to being able to compare against the “meeting or exceeding” standards category of the CRCTs.

First off, the slope of the trendline changed.  This is because just about every school had a higher graduation rate.

This is not surprising.  When you get to determine your own success criteria, you get better than average results even if that doesn’t reflect reality.  That’s one of the reasons we dropped the CRCTs.

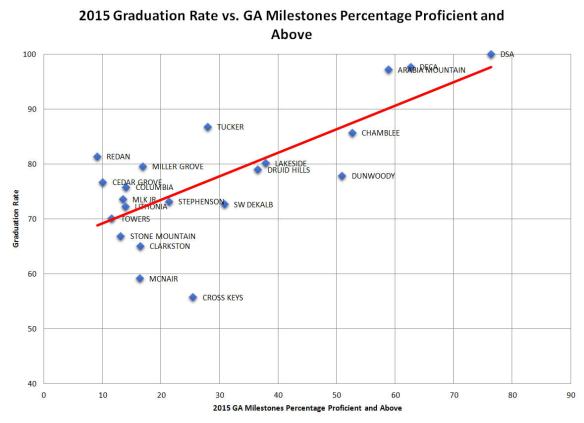
Second, rather than being evenly distributed along the trendline, there is a cluster at the low end, which is even more pronounced when looking at the second graph, which uses the “Proficient Learner” criterion.  The majority of our schools aren’t showing proficiency.

As mentioned above, something doesn’t add up.

I had questioned before if Miller Grove’s jump in graduation rate would be supported by the Georgia Milestones scores.  Arguably, they are supported.  While its graduation rate showed a large increase, the end results are not horribly out of line.  It may simply have been a case of having abnormally low graduation rates in 2014 and now reverting to the mean.

Looking at the data shows the outlier.

Redan has the worst scores of all the schools in the county, other than the alternative schools.  Yet it manages to have the 6th highest graduation rate.  This juxtaposition of low test scores with high graduation rates is similar to what we saw with the CRCT results.

Once may be an anomaly.  Twice could be a coincidence.  Three years running is a pattern.  Something really doesn’t add up.

In general, outliers are worthy of additional examination to find out why they behave differently.  We can explain Cross Keys.  Dr. Green’s administration would do well to try to understand what’s happening at Redan.

Mind the Gap

Previously, I wrote about the false sense of accomplishment that was generated by the CRCTs.  With the recent release of the Georgia Milestones results, it’s evident that there was a significant issue with the rigor of the earlier tests.

Even the state DOE agrees that the CRCTs were basically fluff.  Last year, the Deputy Superintendent of Assessment and Accountability stated:  “As we know, and as has been published widely, Georgia has the lowest achievement expectations in the country.

To address this gap between the state’s tests and the proficiency reported by NAEP, the state decided to go with a Common Core aligned, multi-state test administered by an independent party.  There were basically two choices:  the Partnership for Assessment of Readiness for College and Careers (PARCC) and the Smarter Balanced Consortium.  Georgia chose to go with PARCC, and things were on track.

However, Common Core is a controversial thing in Georgia, and the state soon decided to ditch that approach, citing cost as the primary reason.  Instead, they contracted with McGraw Hill to develop a Georgia specific test using some of the same type of open-ended questions that the PARCC exam uses.  And so the Georgia Milestones were born.

And now we’ve gone through the initial round of testing.  The results are in, and it’s not pretty.  Before we can compare the results, we need to know that the CRCT broke out the scores into three self-explanatory categories:

  • Did Not Meet the Standard
  • Meets the Standard
  • Exceeds the Standard

Georgia Milestones uses four categories:

  • Beginning Learner
  • Developing Learner
  • Proficient Learner
  • Distinguished Learner

Beginning Learners do not yet demonstrate proficiency.  Developing Learners demonstrate partial proficiency and need additional support to be successful in the next grade level.  Proficient Learners are prepared for the next grade level and are on track.

Taking a composite of the end of course tests for six courses (9th Grade Literature, American Literature, Biology, Physical Science, US History, and Economics) across all DeKalb High Schools that graduated more than 50 students in a year, we see the following results from 2013 to 2015:

EOC-MS Results

The percentage of students who met or exceeded standards in 2013 and 2014 (the green and yellow lines) bounced around a bit, but all schools had more students deemed proficient then not.  But then again, we’ve since learned “proficiency” didn’t necessarily mean what we thought it meant.

Looking at the 2015 data, the percentage of students who meet or exceed the “Developing Learner” criterion (the blue line) is noticeably less then the percentage who met or exceeded the 2013 and 2014 criteria for the CRCT End of Course tests.

The percentage of students who actually meet or exceed the “Proficient Learner” criterion (the red line) is significantly less.  Given the report linked above that compared our state exams to the national ones, my guess is the red line is accurate.

And that should make all of us stop and think.

Because if that red line is accurate, then there are only five high schools in DeKalb County in which more than half the students are at or above grade level.

If that line is accurate, then over half the high schools in DeKalb County have fewer than 25% of their students on grade level.

They say the first step to solving a problem is to admit that you have one.  I think the results of the Georgia Milestones make it clear that we have one.

We have two ways to go from here.  We can either work hard, focus on the students and bring their performance up.  It won’t be easy.  It won’t be quick.  Or we can repeat history, take the easy way out, and bring the standard down.

For our children’s sake, I pray we make the right choice.

Hidden Forces

So the Georgia DOE released the latest graduation rates and DeKalb County has seen a 9% increase in the number of students in the 4 year cohort who have graduated.  Make no mistake, a nine percent increase is actually quite an achievement.  This is a number that usually moves no more than a couple of percent per year, so this is a big deal.

However, as with all things, it pays to dig beneath the surface to find the hidden forces that moved the numbers so much.  And what it uncovers is interesting.

The first comment that jumps to many people’s minds is that there must have been an external cause.  One does not simply improve that much that quickly through internal change.  And they would be correct.  As almost all of the stories on the graduation rates have stated, one really big change was that this was the first class to not require the Georgia High School Graduation Test in order to be granted a diploma.  Even the various press releases from the school systems mention that as a factor.

But how much of a factor is the question, and what does the answer to that question tell us?

Let’s take a look at the numbers in Dekalb County Schools.

The schools that were doing well before, and by that I mean schools that had graduation rates higher than 75% in 2014 (which is hardly what I would call “doing well”, but that’s another topic), showed almost no increase in the latest graduation rates.  Chamblee went from 84% to 86%.  Redan went from 80% to 81%.  Lakeside from 77% to 80%.  Arabia Mountain and Dunwoody both dropped a percentage point.  What that tells us is that the end of year test wasn’t really a factor before in these schools, and whatever internal factors that may exist only move the needle a few percentage points.  This is consistent with prior years’ behavior.

The big changes occurred in those schools that were not performing as well in the past.  Leaving aside some of the schools where the small numbers of students can cause statistical anomalies, we still have Tucker jumping 18 percentage points from 69% to 87%.   We see Columbia increasing by 14 points from 62% to 76%, Towers by 16 points from 54% to 70%.  Miller Grove went from 60% to 80%….an increase of 20 points!

The Administration says that the main reasons for the increases are better data reporting to the Georgia BOE and comprehensive graduation services such individualized support programs.  If that were so, we would expect to see similar gains across all schools, not just some of them.  We would expect Stephenson High School to have increased its graduation rate by more then just 1%.  If the gains were due to comprehensive changes in support services, we would expect Cedar Grove High School to improve more than 4%.

What the data shows is that the gains are very uneven.  When we look at the data, removing those schools with 50 or fewer graduating students, we see the average change in graduation rate across DeKalb schools in 2015 was 6.5%.  The standard deviation of the change was 6.4.  Miller Grove’s increase of 20 points lies more than two standard deviations from the mean.  That is outside the bounds of what we would normally expect as random variation.  Something different occurred at Miller Grove than the rest of the high schools in DeKalb.

In the absence of a statewide (or even countywide) test, the decisions of who graduates becomes much more subjective.  Who decides if a student graduates?  How is that decision reached?  What criteria are used, and is it the same set of criteria across the county?  The analysis strongly suggests it is not, and there are other, hidden forces that are responsible for the gains.

The upcoming release of the school results of the Georgia Milestones test will be revealing, and will show if the unusual gains in graduation rates are supported by corresponding scores compared to other schools in the district.

My prediction is they will not.

High Achievers? It’s all relative.

So my 5th grader came home yesterday with some information on Peachtree Middle School.  This is understandable, it’s going to be their new home over the next three years.

What caught my eye was the sheet of paper discussing the “High Achievers” program.  What was interesting about it was not the program itself, and not even the entry criteria.  The interesting part was what the entry criteria tell us about the state of our schools and how we’ve been deluding ourselves.

First let me give you some background.  The State of Georgia defines the requirements for the “Gifted” designation.  A student basically has to score in the top 5% on nationally normed standardized tests such as the Iowa Test of Basic Skills (ITBS) and the Cognitive Abilities Test (CogAT).  Again, these are defined by the state and there’s not much wiggle room, if any.

DeKalb County Schools offers an additional designation of “High Achiever”.  There are a couple of High Achiever magnet schools (Kittredge and Wadsworth are among the better known) and some of the schools have High Achiever programs within them.  In prior years, to get into the High Achiever program at Peachtree Middle School, you had to have either:

  • a score of 825 or higher on the CRCT, or
  • scoring in the 70th percentile or higher on a nationally normed test.

According to the Georgia DOE, CRCT scores generally ranged from 650 to 900 or above.  Scores below 800 are considered to not meet expectations.  Scores between 800 and 849 meet expectations.  Scores at 850 or higher exceed expectations.

With that in mind, the above doesn’t look so bad.  I mean, the middle of the meeting expectations range puts you in the top 30% of students, right?  That’s pretty good.

Along comes 2014 and the Georgia Milestones test that replaces the CRCT.  Since it’s a new test, the state correctly decided not to use its scores in determining graduation eligibility, etc.  Which brings us back around to the note that came home.

In the absence of normalized state test data, DeKalb County is forced to rely solely on nationally normed test scores.  And the new requirements, as of October 16, 2015, are scores that are 55th percentile or higher.  In other words, if you’re slightly above the national average, you’re classified as a High Achiever in DeKalb County.

That’s extremely disturbing.  I don’t say this to denigrate those children who are in the High Achiever programs.  I’m concerned about those children who aren’t in the programs.  The ones that are scoring below the 55th percentile.

I know that we’re not in Lake Wobegon, and all our kids are not above average.  But I believe that the vast majority of our students are not getting the education they need and we’ve been patting ourselves on the back because they passed the CRCT.  It’s been a sham.

And now it’s becoming clear.